Table of contents
Data file used in the example: file.io/86F7M1iYqVUt

Question
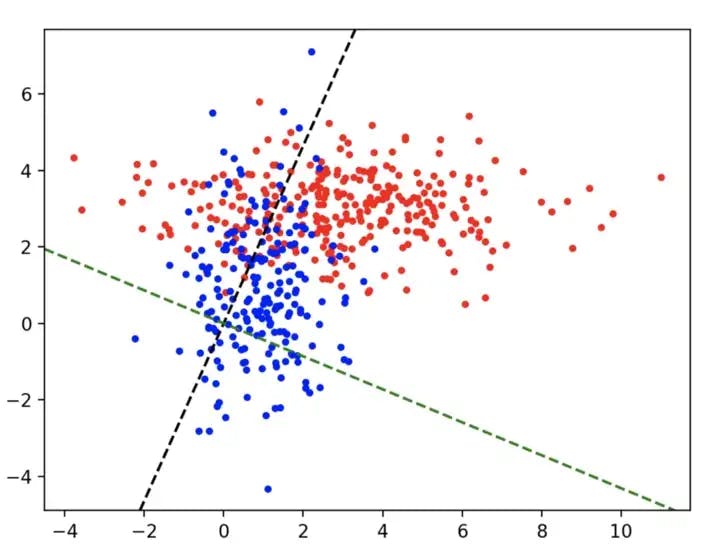
Using the multivariate data in the file fld1.xlsx: (a) determine the discriminant line found by Fishers Linear Discriminant. (b) Plot both the data and the discriminant line on a scatter plot (c) Using this line, determine the class of each of the data points in the dataset, assuming that the threshold is 0 (i.e. positive values are in one class and negative values in the other). (d) Determine what percentage of data points are incorrectly classified. NOTE: The first 2 columns in fld1.xlsx are data columns. The third column is the class to which each data point belongs.
Python Implementation
import pandas as pd
import numpy as np
import matplotlib.pyplot

# read data from excel file fld1 and create a scatterplot
fld1 = pd.read_excel("fld1.xlsx", header=None)
fld1_np = pd.DataFrame.to_numpy(fld1)
output_arr = fld1_np[:,2]
# print(output_arr)

fld1_np_1 = pd.DataFrame.to_numpy(fld1.head(300))
fld1_np_0 = pd.DataFrame.to_numpy(fld1.tail(200))

fld1_class_1 = fld1_np_1[:, :2]
# print(fld1_class_1)

fld1_class_0 = fld1_np_0[:, :2]
#print(fld1_class_0)

data_X = np.concatenate((fld1_class_1,fld1_class_0))
#print(data_X)

matplotlib.pyplot.figure()
matplotlib.pyplot.scatter(fld1_class_1[:,0], fld1_class_1[:,1], c = 'r', marker = '.')
matplotlib.pyplot.scatter(fld1_class_0[:,0], fld1_class_0[:,1], c = 'b', marker = '.')


# Calculate the mean
class1_mean = np.mean(fld1_class_1,axis = 0)
class0_mean = np.mean(fld1_class_0,axis = 0)

# Subtract mean from the data
class1_mc = fld1_class_1 - class1_mean
class0_mc = fld1_class_0 - class0_mean

# Calculate covariance (C=X^T.X/(n-1))
class1_cov = np.dot(class1_mc.T, class1_mc)
class0_cov = np.dot(class0_mc.T, class0_mc)
#print(class1_cov)
#print(class0_cov)

#implement fisher's linear discriminant w = Sw^-1*(u1 - u2)
Sw = class1_cov + class0_cov
w = np.dot(np.linalg.inv(Sw),(class1_mean - class0_mean))

print("Fisher's Linear Discriminant point is: \n",w)
print(w[0])
print(w[1])
matplotlib.pyplot.axline((0,0),w,c='black',linestyle='--')

# calc slope and y-intercept to create a discriminant line
thresh = 0
slope_1 = -w[0]/w[1]
y_intercept = thresh/w[1]
print("y-intercept is ", y_intercept)

matplotlib.pyplot.axline((0,y_intercept),slope = slope_1,c='green',linestyle='--')

# prediction and error calculation
prediction = (np.sign(np.dot(w,data_X.T) + thresh) + 1)/2
error = np.sum(abs(prediction - output_arr))
print("\nnumber of errors = ",error)
print("\npercentage of errors = ",(error/500)*100,"%")

# Q = np.squeeze(data_X[error])

# matplotlib.pyplot.scatter(Q[:,0],Q[:,1], c = 'g', marker = 'o')

matplotlib.pyplot.show()

